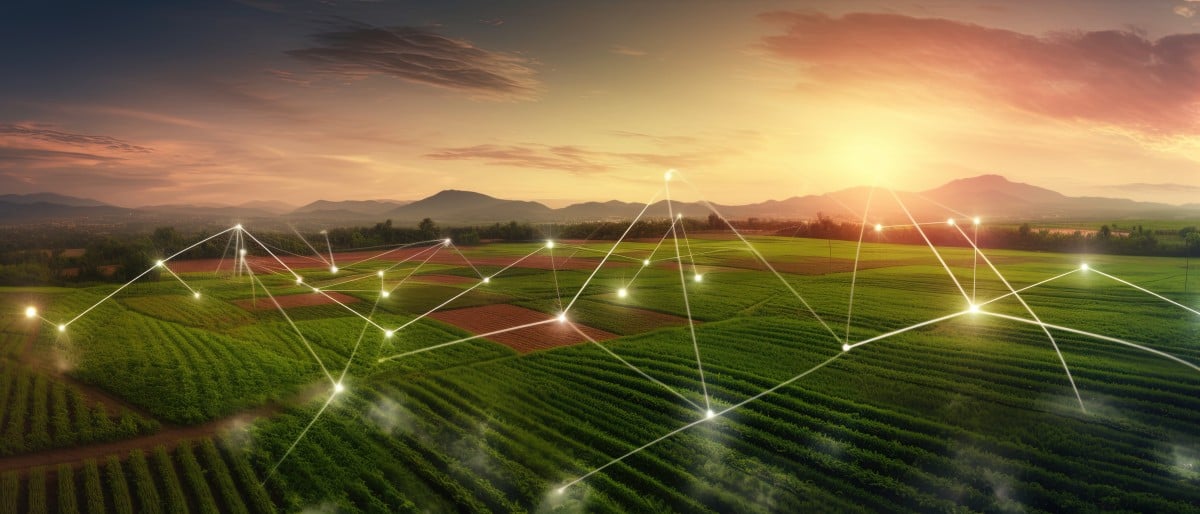
As a business operator, you likely rely on your data to drive decisions. Once you receive the raw numbers, what do you do with it? An abundance of data without any context can quickly become overwhelming. In fact, with new smart farming technology, such as satellites and Internet of Things (IoT) sensors, there’s more data than ever to deal with.
Fortunately, combing through the data to find meaning doesn’t have to be a challenge. Farms that leverage Power BI™ (business intelligence) solutions have the ability to view their data in a manner that provides big-picture insights and makes the raw numbers easy to understand and use.
Data visualization generated by Microsoft’s Power BI™ solutions gives farmers the ability to view their operations in a new light and use their data to generate reports and make informed business decisions.
Quick Links
- What is Data Visualization?
- The Power of Data Visualization for Farmers
- Power BI™ Solutions to Evaluate Farm Data
- Discover Ag Tech for Farm Management
What is Data Visualization?
Each day, your farm generates more and more data. Without proper management and organization, it can quickly become difficult to maintain a good grasp of the status of your farm, including inventory reports, balance sheets, breeding data, and employee information, just to name a few. All of these numbers play a vital role in describing the big picture of your farm operation.
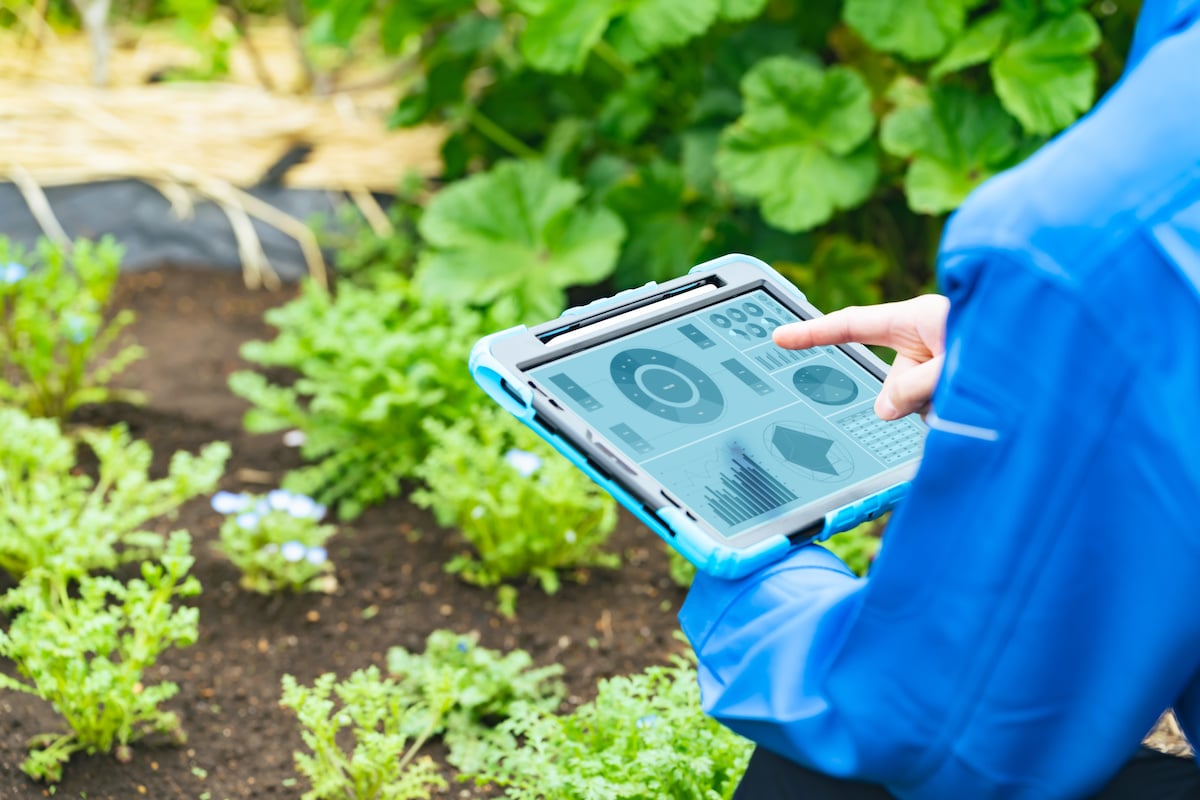
So, what does data visualization mean in practice? To make the most out of your farm data, it needs to be recontextualized. Using graphs, charts, maps, and images, you can reconfigure the way data is presented and use it for strategic decision making.
As you gain insights, these data formats can be shared with other team members or stakeholders as needed.
The Power of Data Visualization for Farmers
By themselves, data points are really just raw numbers. To better understand what this information means and how you can use it to drive farm operations, you need to put those numbers together in a meaningful way. Data visualization allows you to find patterns in your data, ones that show how your farm is performing on a broader scale.
There are several ways to use data visualization to your advantage. After all, data visualization is just how you choose to look at your farm’s raw statistics and numbers.
To spot trends, you might want to reorganize your data into a new format, one that can add additional value. Plus, with effective dashboards embedded within your farm ERP tool, you can easily gather this information in just a few clicks.
Track Trends
Do you know how your farm has been performing over the past few months? What about the past year? Or even the past five years? With data visualization tools, you can create a baseline for performance across multiple sectors on your farm. After a benchmark has been established, you can use incoming data and analysis tools to see how performance has changed over time.
As trends emerge in the data, you can quickly spot any negative trends or outstanding highlights and inspect them for further information. When you notice any operations that are seeing a dip from the baseline data, you can quickly dive deeper into the problem, diagnose the issue, and create a solution to once again boost operational efficiency.
Informative Insights
Data, when thoroughly analyzed, gives you the power to make informed decisions for your farm. With tools that bring enhanced visual clarity to your data, you can find insights that result in improved planning, strategy, action, and decision-making.
Understanding your farm’s key performance indicators and their significance through data visualization will help you leverage your data to make smart decisions for your farm.
See the Big Picture
Raw numbers provide insights to a bigger story. With visualization tools, you can expand on the data points, take a step back, and gain a wide-angle view of all aspects of your farm. Eventually, you’ll notice patterns emerging as you give context to the numbers your farm is generating.
Power BI™ Solutions to Evaluate Farm Data
So, how do you turn your raw data into actionable insights? That’s where business intelligence comes into play. Power BI™ is a tool developed by Microsoft that allows users to take their data and turn it into a visual format. Thanks to this business intelligence solution, Microsoft users are able to move beyond spreadsheets in order to view and analyze data. This, in turn, sheds a new light on farm analytics, allowing farmers to take their data and dive into what these insights mean for their business.
Farm Operations
Power BI™ automations can regularly generate reports regarding business operations. An understanding of how your decisions are impacting overall performance can help you refine strategies and identify inefficiencies. Targeting these areas for improvement will help you increase productivity and drive informed decision making.
Using visual data to analyze farm operations, it would be useful to generate timelines for different processes. This way, you can uncover where processes are being held up and how they can be improved for more efficient and streamlined operations.
Inventory Management
Analyzing farm data through business intelligence tools can show you a real-time, big picture of your inventory. By using these programs, you can gain insights into your supply chain and status of your growing crops and livestock. This kind of information can be critical in monitoring and analyzing costs and margins.
Sales Insights
With business intelligence tools like Power BI™, you can unlock performance insights and trends within your sales. This optimizes returns by meeting your buyers’ scheduling and quality specifications.
To compare sales performance for different inventory items across months, representing data in a matrix format can display side-by-side comparisons. This removes the need for spreadsheets which are often difficult to use when making comparisons.
Financial Reporting
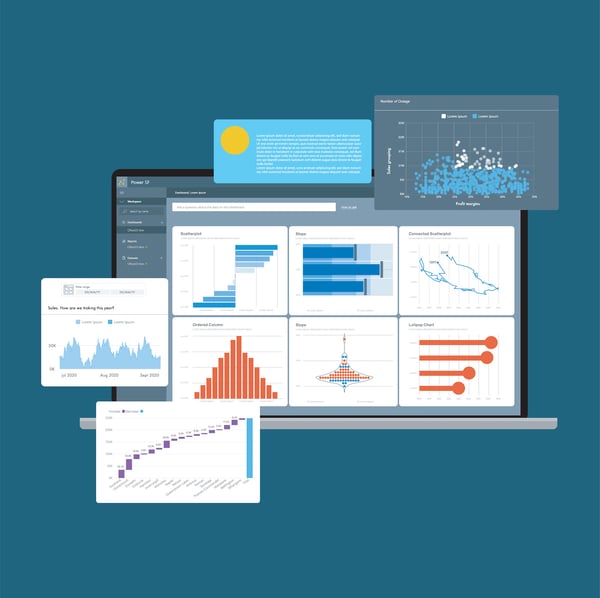
A common functionality across applications of business intelligence technology is the ability to track and analyze trends. When it comes to the financial performance of your farm, Power BI™ solutions can display your financial data through a holistic lens that shows how your financial position has changed from period to period. Customized dashboards within your farm ERP tool means that the data can be viewed in different ways in order to serve different needs.
For example, visualizing total spending in a pie chart might show how you are allocating uses of funds across different sectors of your business. Alternatively, a bar chart would be more useful to show the differences in spending from a month-to-month, year-to-year, or period-to-period basis.
AI Capabilities
The Power BI™ software tool from Microsoft has been equipped with artificial intelligence (AI) features to make the exploration and understanding of data even easier. Now, using plain language commands, users can request the platform to complete actions for them or generate a report regarding the input data. Additionally, the business intelligence tool will pinpoint anomalies in a dataset and provide possible reasons for why it occurred. Further, Power BI™ solutions can instantly summarize data in order to generate meaningful insights, so you don’t need to spend countless hours conducting a deep-dive into what your raw data means.
With these advanced AI features, detailed reports and dashboards are readily available for farmers to use. Manually generating this information used to take time away from day-to-day farm operations. Now, thanks to smart farming technology that incorporates business intelligence tools, analyzing data will be simple and effective. AI will potentially replace the need for specialized developers to help create customized dashboards through a third-party tool. Real-time data will be integrated and analyzed within the Power BI™ program.
Discover Ag Tech for Farm Management
Using farm management software with Power BI™ capabilities, you can use embedded applications and features to quickly view your farm data in a way that provides meaningful insights. Additionally, business intelligence solutions can be used on desktop platforms or mobile devices.
With IoT integrations on your farm, you can turn real-time data from crop analyses and breeding statistics into a visual dataset composed of customizable charts, graphs, images, and more, depending on your needs as a farmer.
Thanks to integrated ERP technology with Power BI™ tools, your farm data will be automatically updated in order to display real-time information and key insights about performance metrics. FBS Systems has joined with the Mutual Agricultural Software Alliance (MASA) to bring these vital analytics tools to your farm. For a closer look at how business intelligence tools like Power BI™ can become an integral part of your farm tech, take a look at this resource from a previous FBS User Conference.
Our ag-specific ERP software combines cloud computing capabilities and Power BI™ data visualization tools to give farmers the resources to understand all aspects of their farm operations and continue to drive business growth. To get started with farm management software solutions from FBS, get in touch with our team right away!


